Local Development Environment for PHP Laravel Applications
This article provides details on my local development environment for PHP Laravel projects using PhpStorm and Docker with xdebug enabled.
We are going to use:
- PhpStorm
- Docker
- Chrome/Firefox (debugging)
This guide is a ‘hello world’ type tutorial to get you up and running with our development environment.
PhpStorm
Why are we using PhPStorm? We need a consistent Integrated Development Environment (IDE) across all developers. An IDE increase programmer productivity by combining common activities such as:
- editing source code
- running unit tests
- version control
- debugging
Installation
Create a account using your email over at phpstorm. Download and install PHPStorm, authenticate software using your account.
https://www.jetbrains.com/community/education/#students
https://www.jetbrains.com/shop/eform/students
During setup, you can add your GitHub account to PhPStorm. You can also select to sync you PhPStorm settings to your JetBrains account. I am fairly new to PhPStorm, so I will be learning along too!
PhpStorm seems to allow the use of many features which are integrated into the software:
- debugging - links to Xdebug extension
- docker - run containers from within IDE
- git - allow you to connect to github account.
I am still looking into build options for our Laravel projects.
Docker
We will be using Docker to setup our development environments
https://blog.jetbrains.com/phpstorm/2018/08/quickstart-with-docker-in-phpstorm/
Install docker desktop using one of the links below, depending on your OS. Note: There are two docker applications which you can installed, one is called docker toolbox and the other is Docker Desktop. Docker desktop is a (more) native application which has some advantages over docker toolbox. For maximum compatibility between our various OS and platforms, we should use docker toolbox. But, after some hair pulling, I could not get toolbox to work consistently on macOS, I presume the same may happen on win10, so we are going to see how we get on with docker desktop.
Guide Windows
https://hub.docker.com/editions/community/docker-ce-desktop-windows
Guide MacOS
https://hub.docker.com/editions/community/docker-ce-desktop-mac/
Once docker is installed, test your docker install. This can be done by running a test docker instance.
docker run -d -p 80:80 docker/getting-started
PhpStorm and Docker and Debugging
Now we plug a few components together and test with a hello world type example.
I followed the tutorial linked below to integrate PhpStorm, Docker and enable Debugging. I will mostly be copy/ paste from the tutorial for the most part, but adding my own explanations where I think more information is required.
https://blog.jetbrains.com/phpstorm/2018/08/quickstart-with-docker-in-phpstorm/
When testing this integration out. I created my own test git repository. I urge you to do the same, and try out the GitHub integration with PhpStorm.
The first step to integrating docker, is to create a docker script. We are going to use docker-compose (which I have explained many times in other articles, you can see docker).
Create new php project in phpstorm
Create file
docker-compose.yml
Add the following script to your docker file.
version: '2'
services:
  webserver:
    image: phpstorm/php-71-apache-xdebug-26
    ports:
      - "80:80"
    volumes:
      - ./:/var/www/html
    environment:
      XDEBUG_CONFIG: remote_host=host.docker.internal
We are going to be using a very simple docker image for testing. All that is contained in this image is php 7.1 along with apache and debugging enabled php-71-apache-xdebug-26
We access this container (once running) on localhost, port 80. (this can be changed if this conflicts on your local machine. To change to http://localhost:8888 simple replace line 6 with - "8888:80"
This docker script then mounts the current directory.
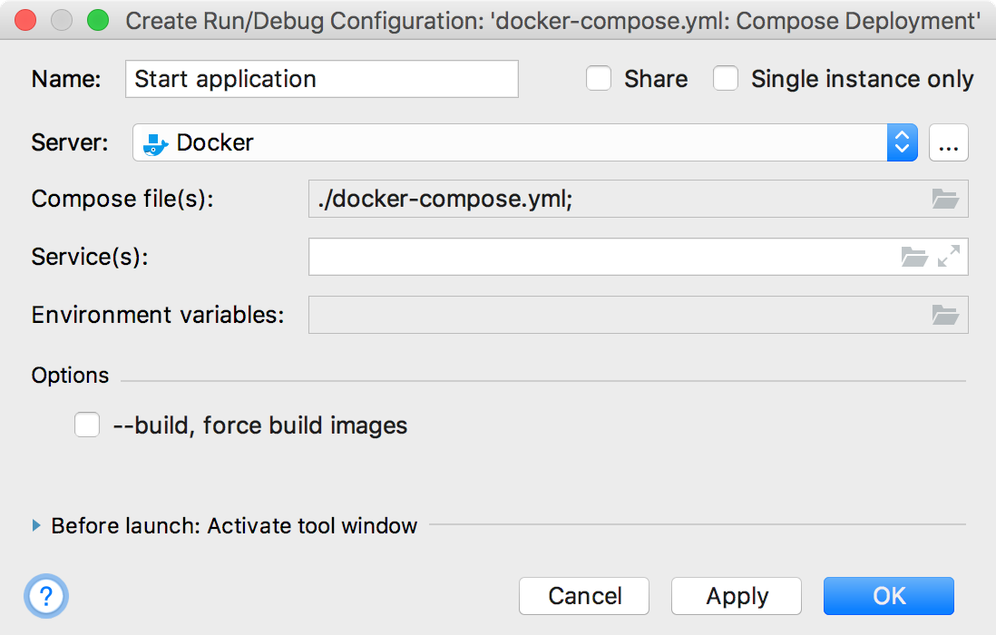
Right-click docker-compose.yml and select create from the context menu.

There will be some options. Make sure you have your docker-desktop program running. Hopefully default values will work here, apply and click ok. You should be able to now start the docker container.

Create a file within the directory HelloWorld.php with the following content
<?php
echo "Hello World";
Test this by going to local host.
http://localhost/HelloWorld.php
If you followed the instructions above, and docker does not start, stop here. Reach out to me, and I will try to help.
Debugging
We have docker setup and it is running php and apache. But it is also running with debugging enabled. We will now finish the setup to get our browser configured with xdebugging information from php into our phpstorm IDE.
Install the debug extension to browser (chrome / firefox)
https://www.jetbrains.com/help/phpstorm/browser-debugging-extensions.html
The browser and debug extension acts as the server, php storm acts as the client.
Add this to the HelloWorld.php file (or create new file, and play with your git repo adding new files and committing, pushing etc).
<?php
echo "Hello World";

$name = 'bob';
$fruits = array('apple', 'pear', 'lemon');

foreach ($fruits as $fruit){
	$output = $name . " likes " . $fruit . "\n</br>";
		echo $output;
}
Enable phpstorm for listening to debugging information by clicking this button on the menu.

Then enable browser to send debugging information by clicking extension in browser.
Refresh the web page in the browser, this should send the debug information to PhpStorm. You should now be able to see variable values (when you run the page in browser, you receive outputs into PhpStorm).
Now we can try some of the debugging features which we have just enabled.
- Add a breakpoint in the code, on line 8.
echo $name... - Run this code in browser
- Check the PhpStorm debug tab (at bottom of window).
This shows the breakpoint and variables at this break point. You can use this to step over code, and show what variables contain, at various stages of the execution etc.
What next?
- Laravel integration into PhpStorm
- Unit, Integration, System and User Acceptance Testing
- Build tools for Laravel applications
- Github actions for deploy, build automation and test server
You can read more about how I have used devops, laravel or docker in my previous projects.
If you have any questions or comments you can contact me.